Maps & data stories
Title work runs on records: millions of them. Every so often I take a public dataset and turn it into something you can actually see: interactive maps and visual stories about how oil & gas got drilled, owned, and recorded. Free to explore, fun to share.
 New · interactive
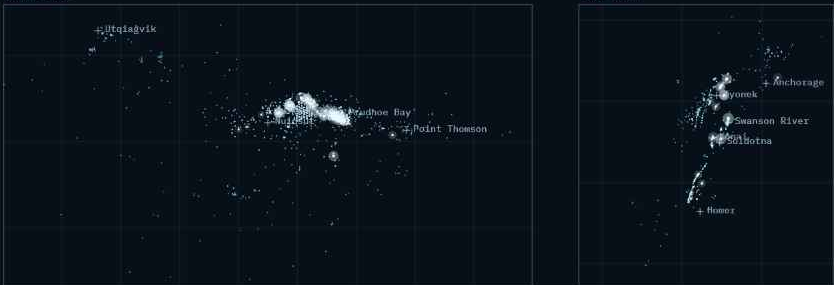
Fifty years of dry wildcats, then Swanson River and Prudhoe Bay turn a territory into a petro-state. Watch 9,356 real wellbores bloom across the two great oil patches — the North Slope and Cook Inlet — drawn side by side on one timeline.
Open the map →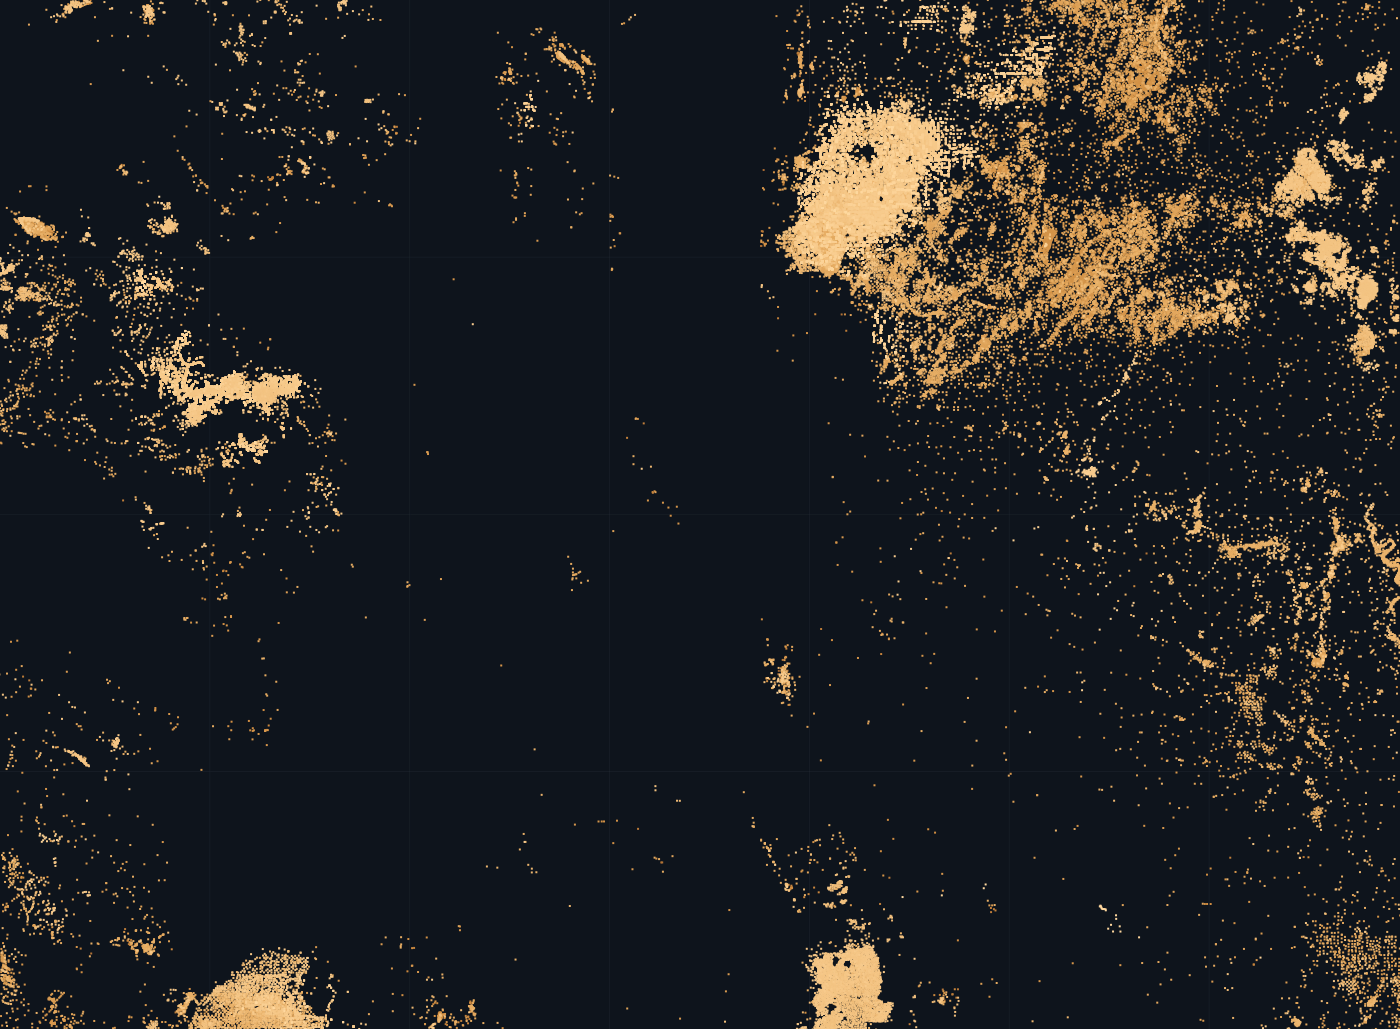 Live · interactive
Press play and watch 89,913 real wellbores bloom across the state: from a single hole near Cañon City in 1862 to the horizontal era in Weld County. The basins fill in one spud at a time.
Open the map →I post a new visual every so often. Drop your email and I'll send a note when the next map goes up: no spam, no funnel.
Got it: I'll send the next map your way. ✦
No spam. No selling your address. Unsubscribe anytime.